Genius Core™ features
Modular 3D Digital Twin developed for industrial needsGenius Core™ 3D Digital Twin is a modular SaaS platform for innovative, fast and efficient data display.

Because no one knows your factory better than you do
Easily configure the platform to match the needs of your production and different production roles
Genius Core™ 3D Digital Twin is the result of our long development process, combining experience and expertise in the needs, environments and challenges of different industries. This is why the platform is built with modular features, allowing our customers to configure the platform themselves or through us. In this way, the required end solution is built from the modules you need to support your day-to-day management – not the other way around.
Role-based dashboards and production reporting
With Genius Core™ dashboards and reports, you can track key metrics, identify areas for improvement and make informed decisions that directly impact the success of your business KPIs.
With Genius Core™ dashboards and reports, you can track key metrics, identify areas for improvement and make informed decisions that directly impact the success of your business KPIs.
Without comprehensive reports, it is almost impossible to assess process efficiency, monitor costs, meet KPIs and find the improvement areas expected of every production manager. We make it easy.
Production data visualization
With the Genius Core™ platform, you get the whole picture of your current production in one view. The view can be fully configured to suit different user roles.
With the Genius Core™ platform, you get the whole picture of your current production in one view. The view can be fully configured to suit different user roles.

Software and machines are constantly evolving, which also creates development pressures for industry leaders. These machines also produce a lot of data, and there can be several data sources in the same factory. Often, there is not just one system, but a number of systems and inputs that are used to collect data from your plant. In addition, different departments in the factory may have different needs.
The platform allows you to monitor from a single view, for example:
Machine-specific utilization and uptime monitoring (OEE)
Machine-specific utilization and uptime monitoring (OEE) is applicable to a wide range of machines. Get an overview of the current status and total capacity of your production plant at a glance.
Machine-specific utilization and uptime monitoring (OEE) is applicable to a wide range of machines. Get an overview of the current status and total capacity of your production plant at a glance.
The platform uses existing information to visualize your production, allowing you to make the necessary changes towards more profitable production and more efficient management. You can grasp the whole picture of your processes, their bottlenecks and reorganise your production where necessary.
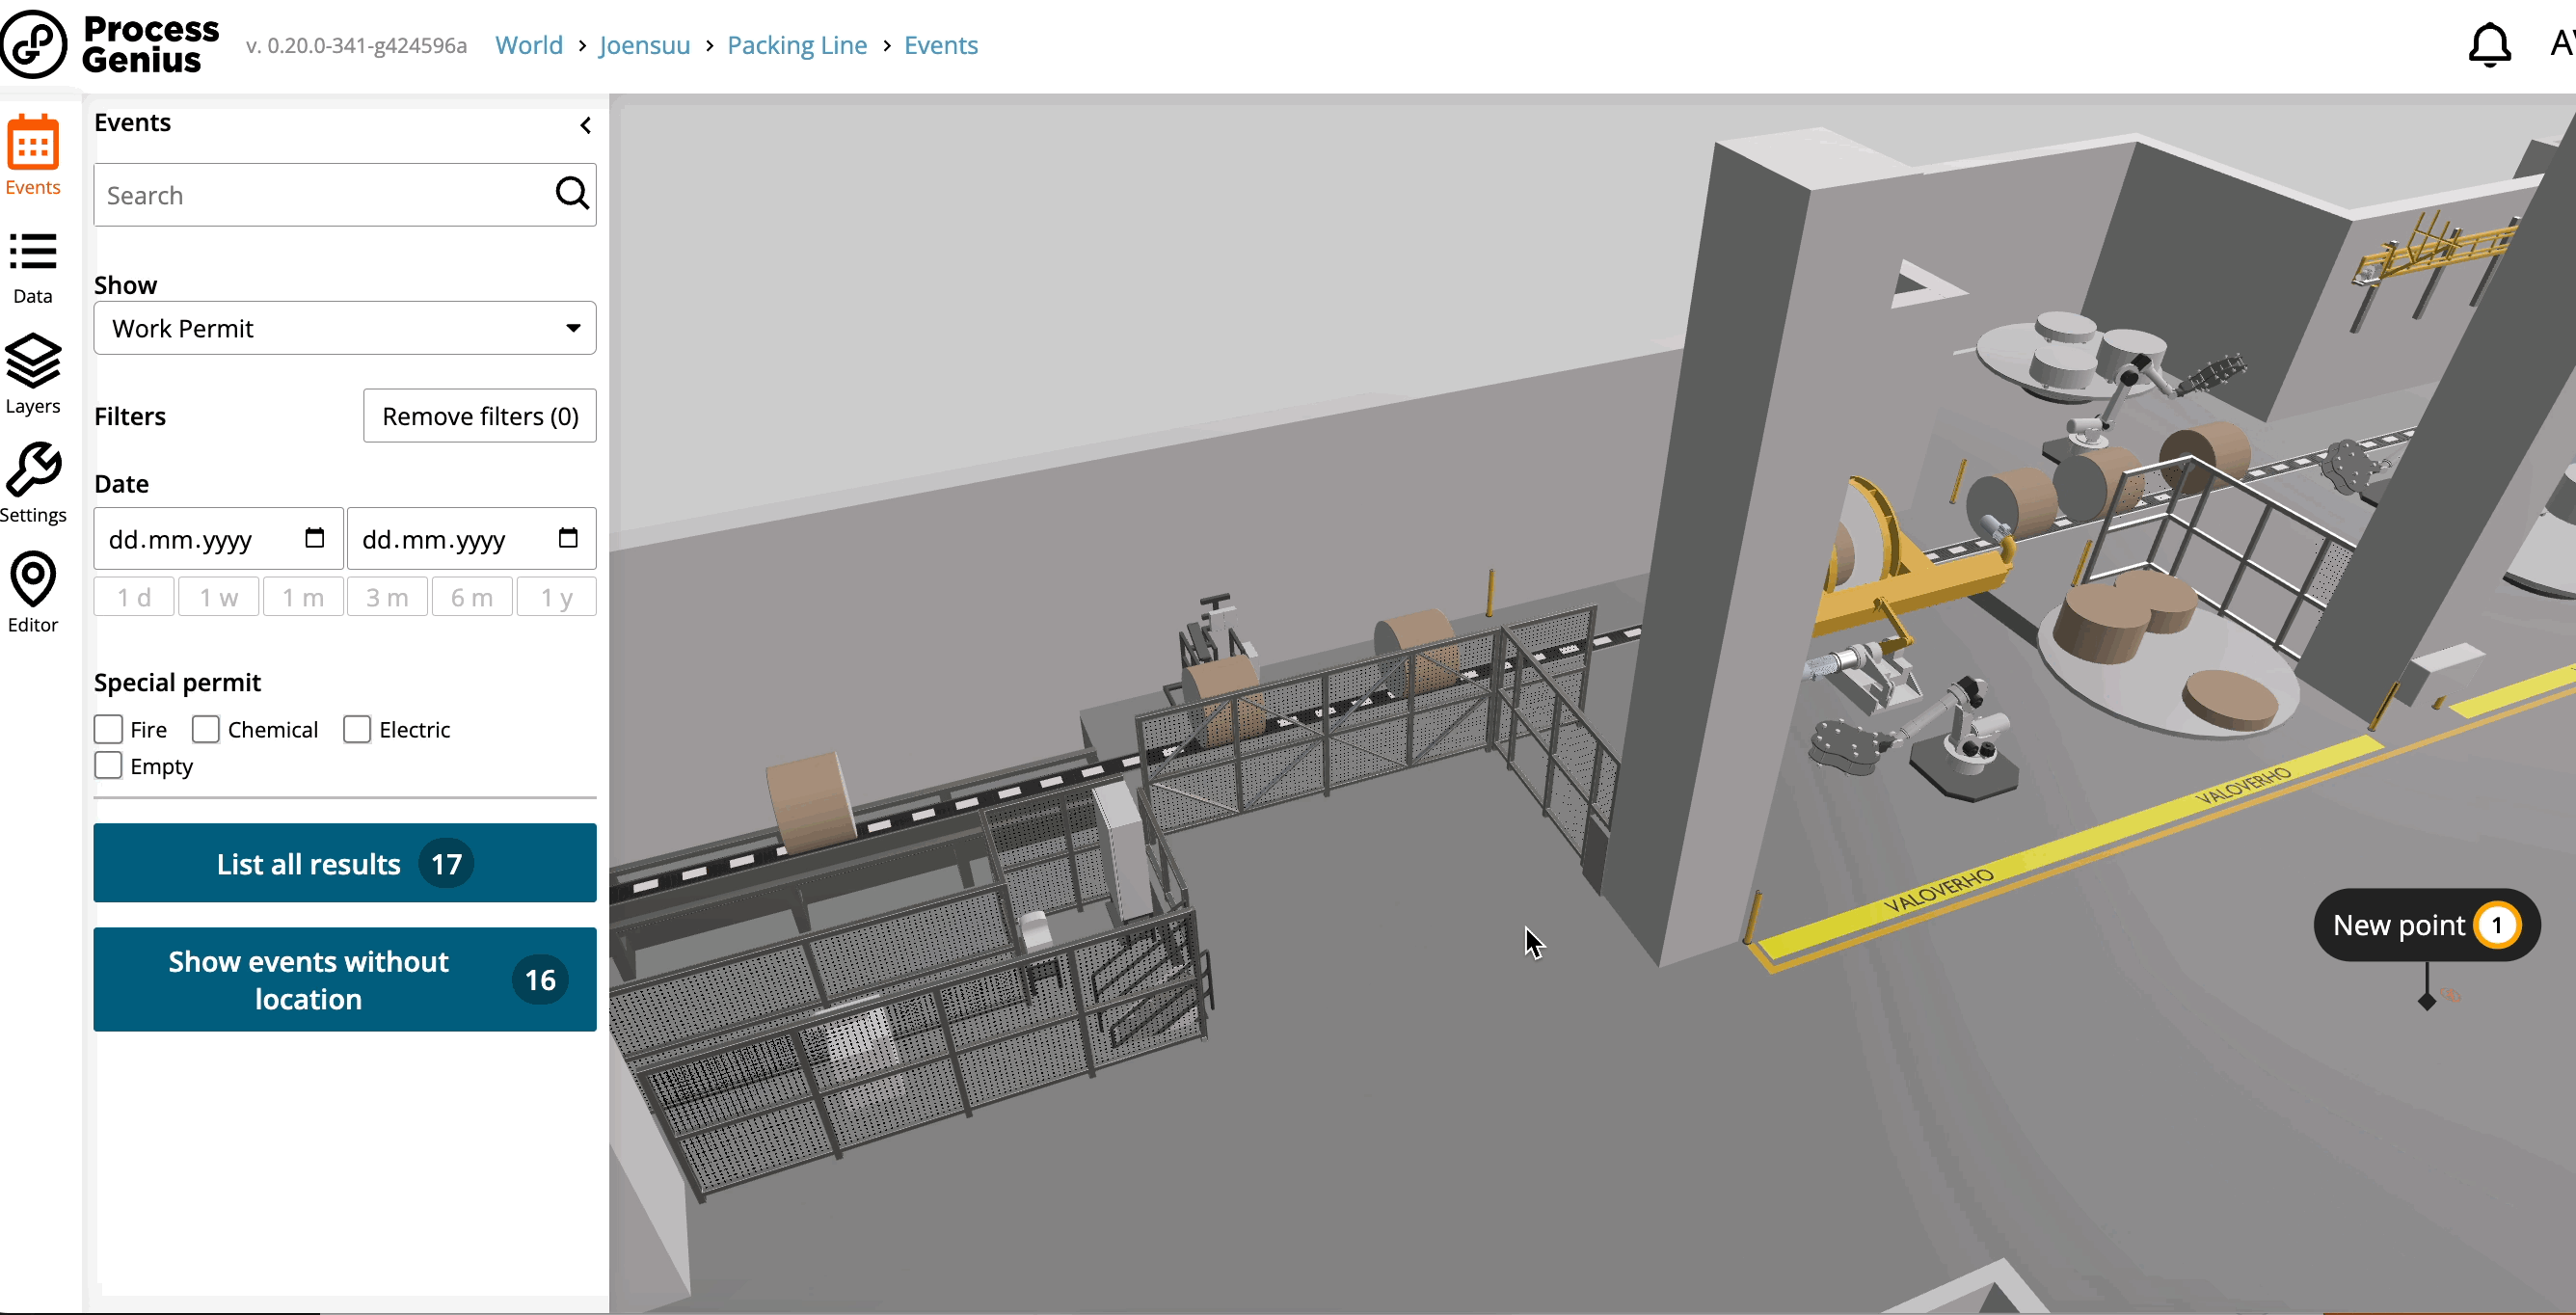
Deviation information and notifications
The Genius Core™ platform will notify you immediately of any deviations in production. You can also link data from another maintenance system to the platform if required.
The Genius Core™ platform will notify you immediately of any deviations in production. You can also link data from another maintenance system to the platform if required.

Would you like to see immediately how the upstream and downstream phases are progressing on the production line and react quickly to any deviations? If part of the production stops due to a break in the production pipeline, costs can quickly escalate.
The platform allows you to visually monitor, for example:
Effective safety management is based on a sense of purpose and systematic approach. The main focus of safety is to reduce and prevent all accidents. All accidents are preventable – in hindsight, there is no accident that could not have been prevented.
With our 3D Digital Twin platform, you’ll have instant access to all safety-related findings and can react to safety threats in a timely manner. The platform quickly shows you where accidents are happening. You can also use the visual view to easily visualize up-to-date safety plan and emergency escape routes.
This is achieved through a comprehensive and up-to-date HSEQ view and plan. The most important thing is to identify and correct potential risk factors before accidents happen.
Through our platform, you will be instantly informed of, for example, fire alarms, gas, liquid and chemical leaks, exceedances of environmental limits (temperature, humidity, vibration, etc.) and other system alarms.
In the platform safety view, you can display all the most important information related to safety at work, such as:
Quality and environmental monitoring
The Genius Core™ platform will notify you immediately of any deviations in production. A digital dashboard makes it easy to monitor quality. You’re up to date with current and historical condition data. In the event of a complaint, you can review the conditions and deviations at the time of the incident afterwards.
The Genius Core™ platform will notify you immediately of any deviations in production. A digital dashboard makes it easy to monitor quality. You’re up to date with current and historical condition data. In the event of a complaint, you can review the conditions and deviations at the time of the incident afterwards.
Can you immediately see how the upstream and downstream phases are progressing on the production line, and can you react quickly to any deviations? If part of the production stops due to a break in the production pipeline, costs can quickly escalate.
Our platform allows you to monitor the status and conditions of your production in real time. Select the required production data for reports. Production efficiency and conditions conveniently available for the desired period.
The visual view also allows you to clearly demonstrate that, for example, self-monitoring is in place and that everything related to quality and product safety is in order and documented. You can make use of documentation for audits, for example.
You can also use our 3D Digital Twin platform to visualize different quality criteria. Product consistency can be easily monitored visually, and deviations can be reacted to more quickly.
The platform allows you to visually monitor, for example:
Predictive maintenance
The platform minimizes the time needed for maintenance shutdowns, their planning and production stoppages. You can forget about ticketing, as the information you need to plan maintenance shutdowns, such as work permits, is available in real time on the platform.
The platform minimizes the time needed for maintenance shutdowns, their planning and production stoppages. You can forget about ticketing, as the information you need to plan maintenance shutdowns, such as work permits, is available in real time on the platform.
Visual information presentation is useful in many other contexts, such as maintenance management, including predictive maintenance and production line performance management.
Predictive maintenance and timely servicing can avoid unplanned production stoppages and the associated multiplier effects. This can lead to significant savings in corrective maintenance.
Our 3D Digital Twin platform can be combined with the maintenance features of existing systems. There may be one large-scale system, or systems from many different suppliers.
Inventory management
The visualization of storage areas on the 3D Digital Twin platform enables the timely use of resources, such as food materials.
The visualization of storage areas on the 3D Digital Twin platform enables the timely use of resources, such as food materials.
For each food or raw material, the desired minimum and maximum levels can be defined. Visual monitoring allows inventory to be visible and ensures that the optimum amount of raw material is in stock.
Inventory optimization can minimize unnecessary waste, ensure smooth production and monitor that the right number of different transport units are available, for example.
The platform allows you to visually monitor, for example:
Monitoring energy efficiency and other indicators of sustainable development
With the 3D Digital Twin platform, you can visualize and thus make visible a variety of sustainability indicators. You can use the data for audits, for example.
With the 3D Digital Twin platform, you can visualize and thus make visible a variety of sustainability indicators. You can use the data for audits, for example.
Visual information presentation is useful in many other contexts, such as maintenance management, including predictive maintenance and production line performance management.
Predictive maintenance and timely servicing can avoid unplanned production stoppages and the associated multiplier effects. This can lead to significant savings in corrective maintenance.
Follow and visualize, for example:
Occupancy and monitoring of premises
Our Digital Twin platform is a complete solution, not a stand-alone system for property management. It brings together existing data from equipment and systems into a single view, taking the monitoring and reporting of risk mitigation measures to a new level.
Our Digital Twin platform is a complete solution, not a stand-alone system for property management. It brings together existing data from equipment and systems into a single view, taking the monitoring and reporting of risk mitigation measures to a new level.

The platform allows you to model floor space, work environments, device locations and plan human flows, for example. Once deployed, monitoring of facilities and people flows will take place in real time.
Based on the usage data, you can take workstations out of service if necessary and ensure safety distances. The 3D image makes it easy to see where the restrictions are targeted. For example, if there are requirements in the environment to restrict sterile or hazardous areas due to chemicals, the information is clearly displayed in a visual format.
Staff and visitor satisfaction also starts before they arrive at your property. Visual approach maps with bus stops, parking spaces and routes to them ensure a smooth arrival.
With our Digital Twin platform, you can find out in no time and also book free working and meeting spaces. Needs vary, and the space reserved can be a team workspace with a specific devices, a quiet workspace or a remote meeting point. Other internal information on the premises is also available from a single view.
All the information you need at one glance. One platform.
Want to know more about our solution for your organization? Please drop us a line and we’ll be in touch!