Industrial data analytics. Benefits and importance for data driven manufacturing.
This article breaks down why data analytics is so important for modern manufacturing and how it helps factories run more efficiently. It also looks at how tools like Power BI make it easier to visualize data and track key metrics in real time. Plus, it introduces a 3D Digital Twin platform that brings all your production data into one simple tool—making it easier to spot issues and improve performance.
- Why data analytics is essential for manufacturing efficiency and growth
- Key benefits of data-driven manufacturing
- The four types of data analytics in manufacturing
- Challenges in managing manufacturing data effectively
- How a 3D digital twin makes OEE tracking simple
- Most common Power BI issues and how to deal with them
- How a 3D Digital Twin simplifies manufacturing analytics
Manufacturing today is more complex than ever. With production lines running at full speed, machine sensors constantly collecting data and global supply chains in motion, factories generate an enormous amount of real-time information every second. But collecting data isn’t the same as using it effectively — the real challenge is turning raw numbers into insights that drive better decisions.
That’s where data analytics come in. By leveraging real-time monitoring, dashboards, and KPI tracking, manufacturers gain a clear, real-time view of what’s happening on the factory floor. Instead of reacting to problems after they occur, companies can predict issues before they happen while optimizing performance and reducing downtime.
The problem? Many manufacturers still struggle with fragmented data, outdated reporting methods and complex analytics tools that don’t always provide actionable insights. Traditional approaches are no longer sufficient as modern factories need a smarter, more integrated way to manage operations.
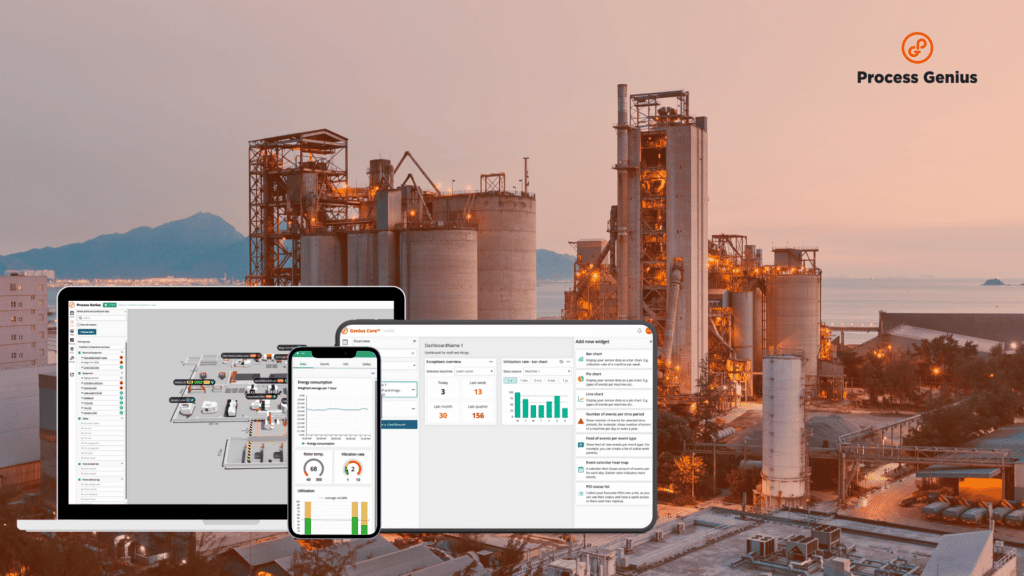
This is where 3D Digital Twin platforms excel. They offer a more interactive and intelligent way to analyze and optimize manufacturing processes. By creating a real-time virtual replica of an entire production system, Digital Twins collect all critical data into one platform, making it easier to visualize performance, identify inefficiencies, and make confident, data-driven decisions.
In this article, we’ll explore how data analytics is transforming manufacturing, what are the challenges of managing production data, and why 3D Digital Twin technology is becoming an essential tool for modern factories looking to stay ahead of the competition.
Why data analytics is essential for manufacturing efficiency and growth
Manufacturing runs on data — machine sensors, production lines, quality checks, and supply chains all generate huge amounts of information every second. But having data isn’t the same as using it effectively. The challenge for many manufacturers is making sense of all this data and turning it into real improvements on the factory floor. Data analytics isn’t just about tracking numbers — it’s about solving problems before they happen.
By analyzing real-time data, manufacturers can:
- Spot production bottlenecks early to keep operations running smoothly.
- Cut costs by optimizing processes and improving the utilization rate of machines.
- Increase product quality by monitoring key production metrics in real time.
Without data-driven insights, decisions are often based on gut feeling or outdated reports, which can lead to wasted time and resources. One of the biggest advantages of data analytics is how it improves decision-making. Instead of waiting for end-of-shift reports, plant managers can use real-time dashboards to see what’s happening on the production floor right now.
- Operational reporting helps teams track manufacturing performance metrics and spot issues before they escalate.
- Real-time dashboards display KPIs for the manufacturing industry, making it easier to monitor efficiency.
- Data visualization tools simplify complex data, helping teams make faster, smarter decisions.
By using real-time monitoring and the right dashboard software, manufacturers can react quickly to machine failures, process inefficiencies, and shifts in demand, ultimately improving Overall Equipment Effectiveness (OEE).
Key benefits of data-driven manufacturing
- Higher OEE – Continuously tracking availability, performance, and quality helps manufacturers optimize Overall Equipment Effectiveness (OEE), leading to better efficiency and higher output.
- Fewer production bottlenecks – Automated downtime tracking pinpoints bottlenecks in manufacturing before they disrupt operations, allowing teams to resolve issues proactively.
- Predictive maintenance & better utilization – Predictive analytics can detect early warning signs of machine failure, enabling scheduled maintenance before breakdowns occur, reducing downtime and extending equipment lifespan.
Using data analytics isn’t just about collecting numbers — it’s about making manufacturing smarter. With the right tools, manufacturers can reduce downtime, increase efficiency, and improve quality — all while making faster, data-driven decisions that keep production running at peak performance.

The four types of data analytics in manufacturing
1. Descriptive analytics – What happened?
This is the starting point for data analytics. It looks at past performance to help manufacturers understand trends and track key metrics such as:
- Operational reports – Show production output, downtime, and efficiency rates.
- Production reports – Summarize performance over a shift, day, or week.
- Real-time dashboards – Provide a live snapshot of machine status, utilization rates and production progress.
With descriptive analytics, teams get a high-level overview of factory performance, making it easier to spot trends and make informed decisions based on historical data.
2. Diagnostic analytics – Why did it happen?
Knowing what happened isn’t enough — you also need to know why. Diagnostic analytics digs deeper into data to find the root cause of inefficiencies and downtime. It’s useful for:
- Root cause analysis – Identifies what led to machine failures, defects or slow production rates.
- Finding production bottlenecks – Pinpoints areas where production slows down or stops.
By analyzing past issues, manufacturers can fix problems at their source and prevent them from happening again.
3. Predictive analytics – What will happen?
Predictive analytics takes things a step further by using historical data and AI to forecast potential issues before they happen. This helps manufacturers to:
- Predict machine failures – Spot early warning signs and prevent unplanned downtime.
- Use automated downtime tracking – Detect patterns that suggest a machine might fail soon.
By using predictive analytics, manufacturers can shift from reacting to problems to preventing them—saving time, reducing costs, and increasing efficiency.
4. Prescriptive analytics – What should be done?
This is the most advanced type of analytics—it doesn’t just predict issues; it recommends solutions using AI-driven insights. Manufacturers use prescriptive analytics to:
- Optimize production performance – AI suggests adjustments to schedules, machine settings and workflows for better efficiency.
- Make real-time decisions – Automated systems help teams react quickly to issues before they impact production.
With prescriptive analytics, manufacturers don’t just identify and prevent problems — they continuously optimize operations for peak performance.
No matter what type of data analytics a manufacturer uses, real-time data and dashboards are essential for making fast, informed decisions. They help production teams to:
- Spot production bottlenecks as they happen, preventing delays before they escalate.
- Track key manufacturing KPIs in real time, ensuring operations stay on target.
- Make confident decisions quickly, based on accurate, up-to-the-minute insights.
By combining real-time monitoring, predictive insights, and AI-driven recommendations, manufacturers can work smarter, not harder — reducing downtime, improving efficiency, and staying ahead of the competition.
Challenges in managing manufacturing data effectively
Manufacturers generate huge amounts of data every day — from machines, sensors, production lines, and quality checks. But having data isn’t the same as using it effectively. If information is scattered across multiple systems or difficult to analyze, it loses its value and becomes just another thing to manage.
To make sense of it all, many companies turn to dashboard software like Power BI. It’s a powerful tool for visualizing real-time data, tracking KPIs, and supporting better decision-making. But while Power BI helps bring data together, it isn’t always enough on its own.
Even with tools like Power BI dashboards, manufacturers often run into challenges like:
- Data scattered across multiple systems – Information is spread across different machines, departments, and software, making it hard to get a clear, real-time view of operations.
- Slow, overloaded dashboards – When working with large datasets, dashboards can become sluggish, making real-time decision-making frustrating.
- Time-consuming, manual reporting – Many manufacturers still rely on manually compiled production reports, which takes time, increases the risk of errors, and delays critical insights.
As an example, many small manufacturers still calculate OEE manually, a process that is time-consuming, tedious, and prone to errors. OEE is a key metric that measures how well machines are running by analyzing three factors:
- Availability – The percentage of time the machine is actually running versus planned production time.
- Performance – How fast the machine runs compared to its maximum speed.
- Quality – The percentage of good parts produced versus the total parts made.
The formula is simple:
OEE = Availability × Performance × Quality

But manually tracking machine uptime, downtime, speed, and defective parts takes a lot of effort. It means constantly collecting data, performing calculations, and updating spreadsheets — leaving room for human error and inefficiencies.
How a 3D digital twin makes OEE tracking simple
With our 3D Digital Twin platform, this entire process is automated. Instead of spending hours tracking OEE manually, manufacturers can see the OEE of every production machine in just one click. This makes the process faster, easier, and far more accurate.
When data is difficult to access or analyze, it limits a manufacturer’s ability to track key metrics like downtime and production bottlenecks. That means missed opportunities for efficiency, cost savings, and overall performance improvements.
Most common Power BI issues and how to deal with them
Power BI is a powerful tool for manufacturing analytics, helping businesses visualize real-time data, track KPIs, and optimize performance. But like any tool, it has its challenges. Many manufacturers struggle with data integration, slow dashboards, and overly complex reports, making it harder to get the insights they need.
Let’s take a look at some of the most common Power BI issues — and how to fix them.
While Power BI is a great tool, it works best when combined with real-time monitoring software like our 3D Digital Twin platform. Instead of struggling with slow dashboards, disconnected data, or manual tracking, manufacturers can see live data from every machine in one click—without complex integrations. By combining Power BI with real-time analytics, manufacturers can eliminate data silos, improve decision-making, and maximize production efficiency.

How a 3D Digital Twin simplifies manufacturing analytics
Manufacturers depend on real-time data to maintain smooth operations, monitor performance, and prevent downtime. However, when information is dispersed across various systems, spreadsheets, and disconnected software, obtaining a clear view of the factory floor becomes challenging.
This is where a 3D Digital Twin transforms the landscape. It creates a real-time virtual replica of your production environment, enabling you to visualize, analyze, and optimize all aspects in one unified platform — eliminating the need to switch between multiple systems.
- Brings all your data together – No more jumping between different software. A 3D Digital Twin pulls data from machines, sensors, ERP systems, and other sources into a single, unified view, eliminating data silos and ensuring seamless access to critical information.
- Provides real-time insights – Instead of relying on static reports, you get a live, interactive view of your entire production process. This allows manufacturers to spot inefficiencies, monitor performance, and make faster, data-driven decisions that drive continuous improvement.
- Automates KPI tracking & predictive maintenance – With automated downtime tracking, you can monitor key performance metrics, detect early warning signs of machine failure, and prevent costly breakdowns. By continuously tracking equipment performance, the platform helps forecast maintenance needs, reducing unexpected downtime and extending machinery lifespan.
- Comprehensive data visualization – A real-time 3D view of your entire facility integrates data from various systems and equipment, offering a holistic perspective that makes it easier to identify bottlenecks, inefficiencies, and areas for improvement.
- Role-based dashboards & Reporting – Customizable dashboards allow different teams to access relevant data based on their roles. This ensures that decision-makers get the right information at the right time, improving efficiency and productivity.
- Enhanced safety monitoring – Receive immediate alerts on safety incidents, near misses, and potential hazards, enabling quick responses to ensure a safer working environment.
- Sustainability tracking – Monitor key sustainability indicators like energy and water consumption, helping manufacturers optimize resource usage, meet environmental compliance, and drive greener production practices.
Data analytics has become an essential tool for modern manufacturing. With real-time dashboards, KPI tracking, and predictive analytics, manufacturers can move away from reactive decision-making and instead optimize efficiency, reduce downtime, and improve overall performance. However, managing and analyzing production data effectively remains a challenge, especially when information is spread across multiple systems. That’s where integrated solutions like a 3D Digital Twin can make a real difference. By bringing all manufacturing data into a single, interactive platform, a 3D Digital Twin helps manufacturers not only track KPIs but actively improve production processes in real time.
If you’re looking for a more efficient way to manage manufacturing data, improve OEE, and make smarter decisions, now is the time to explore how a 3D Digital Twin can enhance your analytics strategy.
Ready to take your data analytics to the next level? Start discovering what a 3D Digital Twin can do for your manufacturing operations today.

Digital Marketing & Business Specialist