
Manufacturing operations generate large amounts of data every day. Machines, sensors, production systems, quality inspections, maintenance activities, and business systems all provide information about how equipment and processes are performing.
The challenge is not simply collecting this data. Manufacturers need to turn it into useful information that helps them understand what is happening, identify problems, improve processes, and make better operational decisions.
Industrial data analytics makes this possible by transforming raw manufacturing data into actionable insights. It can be used to monitor production performance, detect abnormal equipment behavior, identify the causes of process problems, improve quality, optimize resource use, and anticipate future maintenance needs.
As manufacturing environments become increasingly connected, industrial data analytics also provides an important foundation for data-driven manufacturing. Instead of relying only on periodic reports or individual observations, teams can use operational data to understand conditions across machines, production lines, and facilities.
What is industrial data analytics?
Industrial data analytics is the process of collecting, combining, analyzing, and interpreting data generated by industrial equipment, processes, and systems to improve operational decision-making.
In manufacturing, this data can come from sensors, machines, PLCs, production systems, maintenance records, quality systems, ERP and MES platforms, and other operational sources. Analytics methods are then used to identify patterns, trends, relationships, anomalies, and changes in performance.
Industrial data analytics can answer questions such as:
- How is a production line performing right now?
- Why has production efficiency decreased?
- Is a machine behaving differently from its normal operating condition?
- Which process parameters are associated with quality problems?
- When is equipment likely to require maintenance?
- Where are energy, materials, or other resources being used inefficiently?
The analysis can range from relatively simple KPIs, trends, thresholds, and dashboards to statistical models, anomaly detection, machine learning, and predictive analytics.
The goal is not to collect as much industrial data as possible. The goal is to provide the right information, in the right context, so that operators, maintenance teams, production managers, and other decision-makers can take appropriate action.

How does industrial data analytics work?
Industrial data analytics turns data generated by machines, processes, and business systems into information that can support operational decisions. In practice, this usually involves several connected steps, from collecting relevant data to applying the resulting insights in day-to-day operations.
The exact process depends on the use case, but a typical industrial analytics workflow includes the following stages.
1. Collect industrial data
The first step is collecting data from the equipment, processes, and systems relevant to the problem being analyzed.
This can include sensor measurements such as temperature, vibration, pressure, flow, or energy consumption, as well as machine states, alarms, cycle times, production quantities, quality measurements, and maintenance information.
Modern equipment may provide this data directly through connected control systems or Industrial IoT technologies. Industrial communication standards such as OPC UA can also make machine and process data available across different equipment and systems. Older machines can often be connected using additional sensors, gateways, or other data acquisition methods.
2. Integrate and contextualize the data
Industrial data is often distributed across multiple systems. Machine data may be stored in control systems or historians, while production, maintenance, quality, and business information may exist in separate platforms.
Bringing relevant data together creates a more connected manufacturing environment and makes it possible to analyze equipment and processes in a broader operational context.
Context is particularly important. A temperature value alone provides limited information unless it can be associated with a specific machine, component, production process, operating state, or point in time.
Data integration and contextualization therefore create the foundation for meaningful industrial analysis.
3. Analyze patterns and performance
Once the relevant data is available, manufacturers can analyze it to understand how equipment and processes are performing.
Analysis may begin with relatively simple methods such as KPIs, trends, comparisons, statistical calculations, and dashboards. More advanced applications can use statistical models, machine learning, or other analytical methods to identify relationships that are difficult to recognize manually.
For example, production data can reveal changes in cycle times, equipment data can show gradual performance deterioration, and quality data can help identify process conditions associated with defects.
4. Identify anomalies and opportunities
Analytics can then be used to identify conditions that require attention.
This might include an unexpected increase in energy consumption, a machine operating outside its normal range, declining production performance, recurring quality deviations, or unusual combinations of process parameters.
Not every deviation represents a failure. The purpose of analytics is to provide enough context to distinguish meaningful changes from normal variation and help teams focus on the issues that matter.
5. Turn insights into operational actions
Industrial analytics creates value when insights lead to better decisions and actions.
Depending on the use case, an insight might prompt an operator to adjust a process parameter, a maintenance team to inspect equipment, a production manager to investigate declining performance, or an energy manager to address inefficient resource use.
The results of these actions can then generate additional data. Over time, this creates a feedback loop in which operational outcomes are used to improve KPIs, thresholds, analytical models, and future decisions.
Types of industrial data analytics
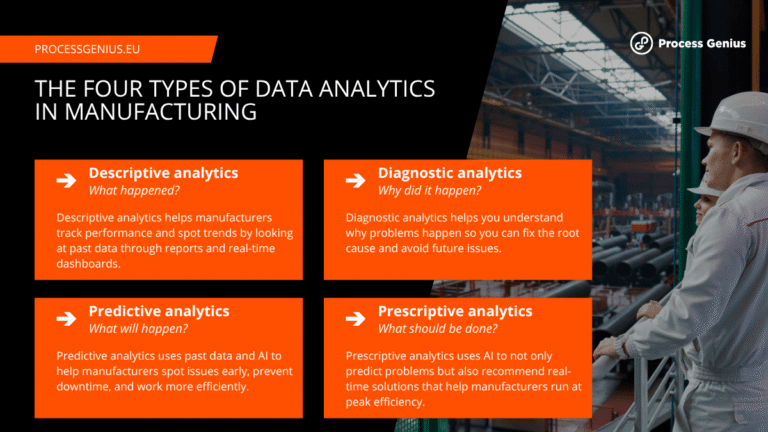
Industrial data analytics can be divided into four main types: descriptive, diagnostic, predictive, and prescriptive analytics. Each addresses a different question, from understanding what has already happened to determining what action should be taken next.
In manufacturing, these approaches often work together rather than independently. A company may start by monitoring historical and current performance, investigate the causes of deviations, predict future outcomes, and eventually use analytics to support decisions about how to respond.
Descriptive analytics
Descriptive analytics answers the question: What happened?
It uses historical and current data to provide visibility into equipment, production, quality, and other operational performance. Common examples include dashboards, reports, trends, KPIs, production counts, downtime records, and energy-consumption summaries.
For example, descriptive analytics might show that production output decreased during a particular shift, that a machine experienced more downtime than usual, or that energy consumption increased during a certain production period.
This type of analysis provides the basic visibility needed to understand operational performance and identify areas that require further investigation.
Diagnostic analytics
Diagnostic analytics goes one step further by asking: Why did it happen?
Instead of simply identifying a change in performance, diagnostic analysis examines relationships between different variables to determine possible causes.
For example, manufacturers might compare machine settings, operating conditions, production batches, maintenance events, and quality measurements to understand why defect rates increased or why a production line experienced an unexpected reduction in throughput.
Techniques can range from comparing trends and correlations to more detailed root-cause analysis across multiple data sources.
Predictive analytics
Predictive analytics asks: What is likely to happen next?
It uses historical and current data to identify patterns that can indicate future conditions or outcomes. Statistical models and machine learning can be used when the relationships within the data are too complex to evaluate effectively using simple rules or thresholds.
In manufacturing, predictive analytics can help estimate future equipment condition, anticipate quality problems, forecast process behavior, or identify an increasing probability of failure.
A common application is predictive maintenance, where equipment and operational data are analyzed to identify developing problems and determine when maintenance may be required before a failure disrupts production.
Prescriptive analytics
Prescriptive analytics asks: What should we do?
It builds on descriptive, diagnostic, and predictive information by helping determine which action may produce the best operational outcome.
For example, prescriptive analytics might support decisions about adjusting process parameters, changing a production schedule, prioritizing maintenance work, or selecting an operating strategy that balances production output, quality, energy consumption, and equipment condition.
Prescriptive approaches can combine analytical models with business rules, optimization methods, simulations, or AI. In practice, the level of automation can vary considerably. Some systems provide recommendations to human decision-makers, while others can support automated adjustments within predefined operational limits.

What data is used in industrial analytics?
Industrial data analytics can use information from many different sources across a manufacturing environment. The specific data required depends on the problem being solved, but useful insights often emerge when machine and sensor data are combined with production, maintenance, quality, and business information.
This data may come from PLCs and control systems, sensors, historians, SCADA systems, maintenance platforms, quality systems, and ERP and MES systems. Rather than replacing these systems, industrial analytics brings relevant information together so it can be analyzed across equipment, processes, and operations.
This provides context around not only what equipment is doing, but also what is being produced, under which conditions, and how operational events affect performance.
Machine and sensor data
Machines, sensors, PLCs, and control systems generate data describing equipment condition and operation.
Typical measurements include temperature, vibration, pressure, flow, speed, torque, electrical current, power consumption, machine states, alarms, and operating hours.
This data can be analyzed to understand normal equipment behavior, identify changes in condition, monitor performance, and detect developing problems.
Production and process data
Production and process data describes how manufacturing operations are performing.
Examples include cycle times, throughput, production quantities, machine utilization, process parameters, operating states, changeovers, stoppages, and production schedules.
Analyzing this information can help manufacturers identify bottlenecks, compare actual performance with targets, investigate production losses, and understand how changes in operating conditions affect output.
Quality data
Quality data can include inspection results, measurements, defect records, scrap rates, rework, test results, and information about production deviations.
When quality information is analyzed together with machine and process data, manufacturers can investigate relationships between operating conditions and product quality.
For example, recurring defects may be associated with particular process parameters, equipment conditions, materials, production batches, or operating periods. Identifying these relationships can help teams address the underlying cause rather than only reacting to the resulting defects.
Maintenance and asset data
Maintenance information provides important historical context for equipment analytics.
This can include work orders, inspection results, maintenance schedules, failure histories, replaced components, repair records, asset hierarchies, and equipment condition information.
Much of this information may be managed through Enterprise Asset Management (EAM) or CMMS systems. Combining maintenance history with real-time and historical equipment data can help teams investigate recurring failures, evaluate asset performance, and make more informed maintenance decisions.
Energy and resource data
Manufacturers can also analyze electricity, gas, water, compressed air, fuel, raw materials, and other resource consumption.
Looking at consumption together with production and equipment data provides more useful information than examining total consumption alone. For example, manufacturers can compare energy use between machines, products, shifts, or operating conditions and identify processes that consume unusually high amounts of energy or other resources.
This can support both cost reduction and more efficient use of industrial resources.
Business and operational data
Industrial analytics can also incorporate information from business and production-management systems.
ERP and MES systems can provide context such as production orders, schedules, inventory, materials, product information, batches, and other operational data.
Combining this information with machine and process data helps connect what is happening on the factory floor with the broader production context. Instead of analyzing an isolated machine value, manufacturers can understand which product was being produced, which order was running, and what operational conditions were present at the time.
The most useful industrial analytics applications therefore rarely depend on a single data source. Combining information from different systems creates the context needed to understand equipment and processes as part of the wider manufacturing operation.

Industrial data analytics use cases in manufacturing
Industrial data analytics can support decisions across production, maintenance, quality, and resource management. The most valuable applications usually start with a specific operational problem and combine the data needed to understand that problem.
Here are some common ways manufacturers can use industrial data analytics.
Production performance and efficiency
Production data can be analyzed to understand how effectively machines, production lines, and processes are operating.
Manufacturers can track metrics such as throughput, cycle times, utilization, stoppages, production losses, and other KPIs. Comparing this information across machines, products, shifts, or time periods can reveal bottlenecks and recurring sources of lost productivity.
Combined with industrial monitoring, analytics can also help teams move beyond periodic reporting toward continuous visibility into production performance. When this operational information needs to be accessed away from the production area or facility, remote monitoring can give authorized users visibility into relevant equipment, process, and performance data from another location. This makes it easier to identify deviations and investigate problems while they are still affecting operations.
Equipment condition and predictive maintenance
Equipment data can be analyzed to identify changes in operating condition that may indicate wear, degradation, or a developing fault.
For example, trends in vibration, temperature, electrical current, pressure, or other condition indicators can be compared with historical behavior and maintenance information. Changes that develop gradually may provide an opportunity to investigate equipment before a failure occurs.
This is an important foundation for predictive maintenance, where equipment condition and operational data are used to anticipate maintenance needs and potential failures. Maintenance teams can then plan interventions based on the condition of the equipment rather than relying only on fixed schedules or waiting for a breakdown.
By identifying developing equipment problems earlier, industrial analytics can also help manufacturers reduce unplanned downtime and avoid some of the production losses associated with unexpected equipment failures.
Anomaly and fault detection
Industrial analytics can identify unusual behavior that differs from expected operating conditions.
An anomaly might be a sudden change in a sensor value, an unusual combination of process parameters, a gradual shift in machine behavior, or a production result that falls outside its normal pattern.
Detecting these deviations early can help operators and maintenance teams investigate potential problems before they develop into larger operational disruptions.
Anomaly detection can use predefined thresholds and rules, statistical methods, or more advanced analytical models depending on the equipment, available data, and complexity of the process.
Quality monitoring and improvement
Combining quality data with machine and process information can help manufacturers understand why defects and variations occur.
Instead of looking only at the final inspection result, analytics can examine the conditions under which a product was manufactured. Teams can compare process parameters, machine settings, environmental conditions, materials, production batches, and other variables with quality outcomes.
Over time, this can reveal patterns associated with defects, scrap, or rework and help manufacturers maintain more consistent process conditions.
Process optimization
Industrial data analytics can also be used to identify opportunities to improve how production processes operate.
By comparing process parameters with outcomes such as throughput, quality, energy consumption, and equipment performance, manufacturers can determine which operating conditions produce better results.
For example, analysis may reveal that certain parameter combinations increase cycle times, that particular operating conditions lead to unnecessary energy consumption, or that small process adjustments improve product consistency.
These insights can support continuous improvement and provide a data-based foundation for process optimization.
Energy and resource optimization
Energy and resource consumption can be analyzed in relation to production output, equipment condition, products, shifts, and operating conditions.
This makes it possible to move beyond facility-level consumption totals and investigate where resources are actually being used.
Manufacturers can identify equipment with unusually high energy consumption, compare energy use per unit produced, detect inefficient operating periods, and evaluate whether process changes reduce electricity, compressed air, water, materials, or other resource use.
Industrial data analytics therefore supports not only production performance but also efforts to reduce manufacturing costs and use resources more efficiently.

Benefits of industrial data analytics
Industrial data analytics can help manufacturers make better use of information that already exists across machines, production processes, and operational systems. The benefits depend on the use case and the quality of the available data, but several advantages apply across many manufacturing environments.
Better operational visibility
Manufacturing information is often distributed across machines, control systems, production platforms, maintenance tools, and business systems.
Industrial data analytics can bring relevant information together and make operational performance easier to understand. Instead of relying on isolated data points or separate reports, teams can examine equipment, production, quality, and resource information in context.
This provides a clearer view of what is happening across manufacturing operations and where attention may be required.
Faster and more informed decisions
Access to timely and contextualized data can reduce the amount of time teams spend collecting information and trying to determine what happened.
Operators, maintenance teams, engineers, and production managers can use analytics to identify changes in performance, investigate possible causes, and compare current conditions with historical behavior.
This supports decisions based on operational evidence rather than relying only on assumptions, periodic reports, or individual observations.
Reduced downtime
Industrial analytics can help identify equipment deterioration, recurring faults, abnormal operating conditions, and other problems that may eventually interrupt production.
Earlier visibility gives maintenance and production teams more time to investigate developing issues and, where appropriate, plan maintenance before equipment failure causes an unexpected stoppage.
The result can be fewer unplanned interruptions and better availability of critical production equipment.
Improved production efficiency
Analyzing cycle times, throughput, stoppages, utilization, process parameters, and other production data can reveal where performance is being lost.
Manufacturers can identify bottlenecks, recurring delays, inefficient operating conditions, and differences between machines, products, shifts, or production periods.
These insights provide a data-based foundation for improving processes and making better use of existing production capacity.
Better quality and process consistency
Industrial analytics can connect quality outcomes with the conditions under which products were manufactured.
By examining process parameters, equipment behavior, materials, environmental conditions, and quality measurements together, manufacturers can identify patterns associated with defects or process variation.
Understanding these relationships can help teams address the causes of quality problems and maintain more consistent operating conditions.
Lower operational costs
Improvements in equipment availability, production efficiency, quality, maintenance planning, and resource use can contribute to lower operating costs.
Analytics can help manufacturers identify where production losses occur, where resources are being consumed inefficiently, and where maintenance or process improvements may have the greatest operational impact.
Rather than treating cost reduction as a separate activity, industrial data analytics provides information that can help teams identify and prioritize opportunities to reduce operational costs across manufacturing operations.

Common industrial data analytics challenges
Industrial data analytics can provide valuable operational insights, but implementing it successfully is not simply a matter of collecting more data. Manufacturing environments often contain equipment of different ages, separate information systems, inconsistent data structures, and processes that were not originally designed for integrated analytics.
Understanding these challenges early can help manufacturers build a more reliable foundation for industrial analytics.
Data silos and disconnected systems
Manufacturing data is often distributed across PLCs, SCADA systems, historians, MES and ERP platforms, maintenance systems, quality applications, spreadsheets, and other sources.
When these systems operate independently, it can be difficult to analyze information across the entire production process. Teams may have access to individual datasets but still lack a connected view of equipment, production, maintenance, and quality.
Breaking down these data silos does not necessarily mean replacing existing systems. A more practical approach is often to connect relevant sources and make their information available in a common operational context.
Poor data quality
Analytics results depend heavily on the quality of the underlying data.
Missing measurements, incorrect sensor values, inconsistent timestamps, duplicate records, changing naming conventions, and incomplete maintenance information can all reduce the reliability of analysis.
Data therefore needs to be validated, cleaned, and monitored over time. Manufacturers also need to understand which data is sufficiently reliable for a particular use case rather than assuming that every available dataset should be included.
Legacy equipment and connectivity
Many factories operate a mixture of modern connected machines and older equipment that was never designed to provide data to external systems.
Legacy machines may use proprietary interfaces, older communication protocols, or provide very limited digital information. In other cases, useful operating data exists within a machine but is not easily accessible.
Connecting these assets may require gateways, additional sensors, protocol conversion, or other integration methods. The objective should be to obtain the data required for the use case rather than connecting every machine simply because it is technically possible.
Lack of data context
Collecting a measurement does not automatically make it useful.
For example, knowing that a sensor recorded a particular temperature has limited value without understanding which asset it belongs to, what the machine was doing at the time, which product was being manufactured, and whether the value represents normal operation.
Industrial analytics therefore requires context around assets, processes, production events, and relationships between different data sources. A structured Digital Twin ontology can help define these relationships and organize industrial information around the physical equipment and processes it represents.
Too much data without actionable insight
Industrial environments can generate enormous volumes of data, but more data does not automatically lead to better decisions.
Manufacturers may collect thousands of measurements while operators and managers still struggle to determine which information requires attention. Dashboards can create the same problem if they display large numbers of KPIs without clearly connecting them to operational decisions.
Successful industrial analytics should therefore begin with specific questions or problems. Data, KPIs, alerts, and analytical models can then be selected according to the decisions they need to support.
Skills and organizational adoption
Industrial analytics combines knowledge from several areas, including manufacturing processes, equipment, automation, data engineering, analytics, and IT.
Technical specialists may understand the data but lack detailed knowledge of the production process, while operators and maintenance teams may understand the equipment but need support interpreting analytical results.
Successful adoption therefore requires collaboration between these groups. Analytics should also fit existing operational workflows so that insights reach the people who can act on them. A technically sophisticated model provides little value if its results are difficult to understand or are not used in day-to-day decisions.

How to implement industrial data analytics
Implementing industrial data analytics is most effective when it starts with a specific operational need rather than with the technology itself. Manufacturers do not necessarily need to connect every machine or integrate every available system before analytics can provide value.
A practical approach is to begin with a clearly defined problem, identify the data required to address it, validate the results, and then expand to additional equipment, processes, or use cases.
1. Define the operational problem
The first step is deciding what the analytics initiative should help improve.
This could be reducing equipment downtime, identifying production bottlenecks, improving product quality, reducing energy consumption, or understanding why a process is performing inconsistently.
The problem should be specific enough to determine what information is needed and how success will be measured. Starting with a clearly defined operational objective also helps prevent projects from becoming broad data-collection exercises without a clear business purpose.
2. Identify the required data
Once the problem is defined, determine which data is needed to understand it.
For an equipment-related use case, this might include vibration, temperature, machine states, alarms, operating hours, and maintenance history. A quality use case might require process parameters, production batches, machine settings, and inspection results.
It is also important to determine whether the required data already exists, where it is stored, how frequently it is available, and whether its quality is sufficient for the intended analysis.
3. Connect relevant data sources
The next step is making the required information accessible for analysis.
Depending on the use case, data may need to be collected from machines, PLCs, sensors, historians, SCADA systems, maintenance applications, MES, ERP, quality systems, or other industrial platforms.
Existing systems should be used wherever practical rather than creating unnecessary parallel data sources. Manufacturers can begin with the machines and systems directly relevant to the selected use case and expand connectivity as additional analytics applications are introduced.
4. Clean and contextualize the data
Before analysis, the data needs to be sufficiently reliable and understandable.
This can involve handling missing values, aligning timestamps, standardizing units and naming conventions, validating measurements, and resolving inconsistencies between different systems.
The data should also be connected with operational context. Machine measurements, for example, become more useful when they can be associated with the correct asset, operating state, production order, product, maintenance event, or process stage.
This contextualization makes it possible to analyze relationships between information that originally came from separate systems.
5. Select analytics methods and KPIs
The analytical approach should match the operational problem.
Some use cases may only require trends, comparisons, thresholds, and clearly defined KPIs. Others may benefit from statistical analysis, anomaly detection, predictive models, optimization methods, or AI.
The most advanced method is not automatically the most useful. Manufacturers should select an approach that produces sufficiently reliable information for the decision being supported and that users can understand and act upon.
KPIs should follow the same principle. Each metric should help answer a meaningful operational question rather than simply adding more information to a dashboard.
6. Visualize insights for the right users
Analytics results need to reach the people responsible for acting on them.
Operators may need real-time information about a machine or production process, while maintenance teams may need condition trends and alerts. Production managers may require a broader view of performance across lines, shifts, or facilities.
Dashboards, alerts, reports, and other visualizations should therefore be designed around the needs of specific users rather than presenting the same information to everyone.
In more complex manufacturing environments, a Digital Twin implementation can provide an additional way to connect operational information with the machines, assets, and processes it represents.
7. Validate results and scale gradually
Industrial analytics should be validated using real operational outcomes.
Teams need to determine whether alerts identify meaningful conditions, whether analytical models remain reliable, whether KPIs accurately represent performance, and whether the resulting insights actually support better decisions.
Feedback from operators, maintenance personnel, engineers, and other users is particularly important because they can identify situations that may not be obvious from the data alone.
Once a use case has demonstrated value, the approach can be expanded to additional machines, production lines, facilities, or analytical applications. Scaling gradually allows manufacturers to reuse successful integrations and methods while improving the analytics approach based on practical experience.

Industrial data analytics and AI
Artificial intelligence and machine learning can extend industrial data analytics when manufacturing data contains patterns or relationships that are difficult to identify using conventional rules, thresholds, or statistical methods.
Machine learning models can analyze historical and real-time data to recognize patterns, classify operating conditions, identify unusual behavior, estimate future outcomes, and support optimization. In manufacturing, these capabilities can be applied to equipment condition, production performance, quality, process behavior, energy consumption, and other operational areas.
For example, AI-based analytics can help identify complex relationships between process parameters and product quality, recognize changes in equipment behavior that may indicate developing problems, or estimate how a process is likely to perform under different operating conditions.
However, AI is not required for every industrial analytics use case. Many operational problems can be addressed effectively using KPIs, trends, statistical analysis, rules, thresholds, and other established analytical methods.
The appropriate approach depends on the problem, available data, required accuracy, and how the resulting information will be used. A simpler and transparent analytical method may be more valuable than a complex AI model if it provides reliable information that operators, engineers, and managers can understand and act upon.
AI also depends on the same foundations as other forms of industrial analytics. Relevant and reliable data, sufficient operational context, clearly defined objectives, and validation against real manufacturing conditions remain essential.
As these foundations improve, AI can become another analytical tool for helping manufacturers identify patterns, anticipate changes, and support more informed operational decisions.
How Digital Twins support industrial data analytics
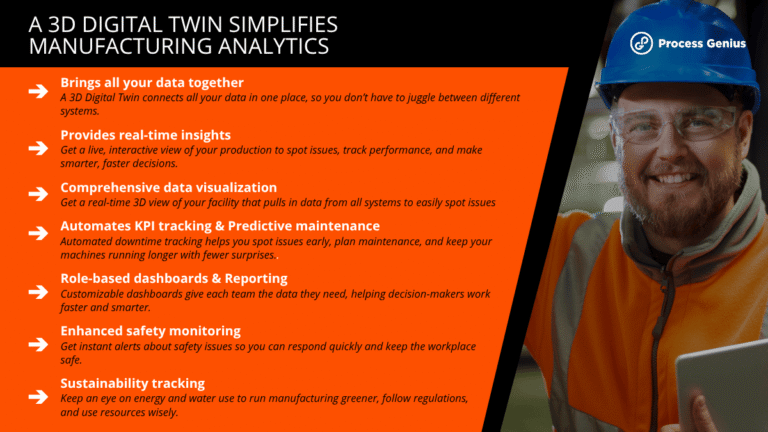
Industrial data analytics becomes more useful when data can be connected to the physical equipment, processes, and environments it represents. A Digital Twin in manufacturing can provide this context by creating a digital representation of physical assets and connecting relevant operational information to them.
Rather than replacing existing analytics tools or industrial systems, a Digital Twin can act as a contextual layer that brings information from different sources together and makes analytical results easier to understand and use.
Bringing data from different systems together
Manufacturing information is often distributed across machines, sensors, automation systems, maintenance platforms, production systems, and business applications.
A Digital Twin can connect relevant information from these existing sources around the assets and processes they describe. This allows users to access data from different systems through a shared operational environment instead of examining each source independently.
For industrial analytics, this creates a more complete view of the conditions surrounding a machine, production line, or process.
Adding asset and process context
Raw industrial data can be difficult to interpret without knowing where it came from and how different pieces of information relate to one another.
A Digital Twin can associate data with specific machines, components, locations, production processes, and other physical elements. Relationships between these elements can also provide additional context for analysis.
For example, an unusual measurement can be viewed together with information about the affected asset, nearby equipment, operating conditions, maintenance history, and relevant production data.
This helps transform isolated measurements into information that can be interpreted within the actual manufacturing environment.
Visualizing operational data
Industrial analytics is often presented through dashboards, charts, tables, and alerts. These formats are useful, but users may still need to determine where the information relates to the physical environment.
A visual Digital Twin can present operational data in the context of the factory, production line, machine, or component it represents.
Users can navigate through the digital environment, locate equipment, examine relevant KPIs and measurements, and identify where an alert or abnormal condition is occurring.
This can make complex industrial information more accessible, particularly when users need to understand relationships between data and physical assets.
Connecting analytics with the physical environment
A Digital Twin can also provide a common interface between analytical results and day-to-day industrial operations.
For example, an analytics system may identify declining equipment performance, unusual energy consumption, or another condition requiring attention. Within a Digital Twin, that information can be connected directly to the affected asset or process and presented alongside other relevant operational information.
This helps users move from identifying a data-based issue to understanding where it is occurring and what equipment, process, or surrounding conditions may be involved.
In this way, Digital Twins can support industrial data analytics by providing the physical and operational context needed to turn analytical results into information that is easier to interpret and act upon.
Industrial data analytics with Process Genius
Industrial data analytics becomes easier to use when information from different manufacturing systems can be accessed in a common operational environment.
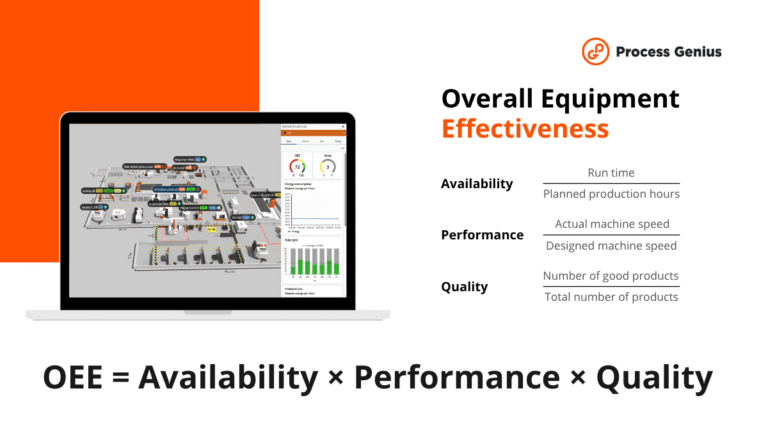
Process Genius supports this through Genius Core™, a 3D Digital Twin platform that brings data from machines, sensors, production systems, and other sources into a visual representation of the manufacturing environment.
Instead of viewing operational information only through separate systems, spreadsheets, or dashboards, users can connect data with the machines, production lines, and areas it represents. This provides additional physical context for KPIs, equipment condition, production performance, downtime, energy consumption, and other operational information.
The platform can also support real-time monitoring, KPI tracking, dashboards, alerts, and visualization of manufacturing data for different operational roles. This helps operators, maintenance teams, production managers, and other users access relevant information within the context of their production environment.
Genius Core™ does not replace the underlying ERP, MES, maintenance, automation, or analytics systems. Instead, it can bring information from these sources together and make it accessible through a shared 3D operational view.
For manufacturers dealing with data spread across multiple systems and equipment, the Genius Core™ 3D Digital Twin platform provides a way to connect industrial data with the physical manufacturing environment and make operational information easier to access, understand, and use.
FAQs
What is industrial data analytics?
Industrial data analytics is the process of collecting, combining, analyzing, and interpreting data from industrial equipment, processes, and systems to support operational decision-making. In manufacturing, it can be used to understand production performance, equipment condition, quality, resource consumption, and other aspects of operations.
What is an example of industrial data analytics?
One example is analyzing machine vibration, temperature, operating hours, and maintenance history to identify changes in equipment condition. Manufacturers can use these insights to investigate developing problems and plan maintenance before an unexpected equipment failure interrupts production.
Other examples include analyzing production data to identify bottlenecks, connecting process parameters with quality results, and comparing energy consumption across machines or production periods.
What types of data are used in industrial analytics?
Industrial analytics can use machine and sensor data, production and process data, quality measurements, maintenance records, energy and resource consumption, and information from business and operational systems such as ERP and MES.
The data required depends on the operational problem being analyzed. In many cases, combining several data sources provides more useful insights than analyzing one dataset independently.
What are the four types of industrial data analytics?
The four main types are descriptive, diagnostic, predictive, and prescriptive analytics.
Descriptive analytics explains what happened, diagnostic analytics investigates why it happened, predictive analytics estimates what is likely to happen next, and prescriptive analytics helps determine what action should be taken.
How is industrial data analytics used in manufacturing?
Manufacturers can use industrial data analytics to monitor production performance, identify equipment problems, support maintenance planning, detect anomalies, investigate quality issues, optimize processes, and improve energy and resource efficiency.
The specific application depends on the available data and the operational decisions the manufacturer wants to improve.
What is the difference between industrial data analytics and business analytics?
Industrial data analytics focuses primarily on data generated by manufacturing equipment, production processes, and operational systems. It often works with machine states, sensor measurements, process parameters, production events, maintenance information, and other operational data.
Business analytics typically focuses more on areas such as finance, sales, customers, inventory, and overall business performance. The two can overlap when operational manufacturing data is combined with ERP and other business information.
Does industrial data analytics require AI?
No. Many industrial analytics applications can be implemented using KPIs, trends, thresholds, statistical methods, rules, and dashboards.
AI and machine learning can be useful when manufacturers need to identify more complex patterns, classify operating conditions, predict future outcomes, or analyze relationships that are difficult to capture with simpler methods. The appropriate approach depends on the problem and the available data.
How do Digital Twins support industrial data analytics?
Digital Twins can connect industrial data with the physical assets and processes it represents. Data from machines, sensors, production systems, maintenance platforms, and other sources can be organized around a digital representation of the manufacturing environment.
This provides additional context for analytics and can make it easier for users to understand where operational information comes from, how different data relates to physical equipment, and where identified problems are occurring.