Data visualization at Snellman: real-time insights
Partner
Snellman
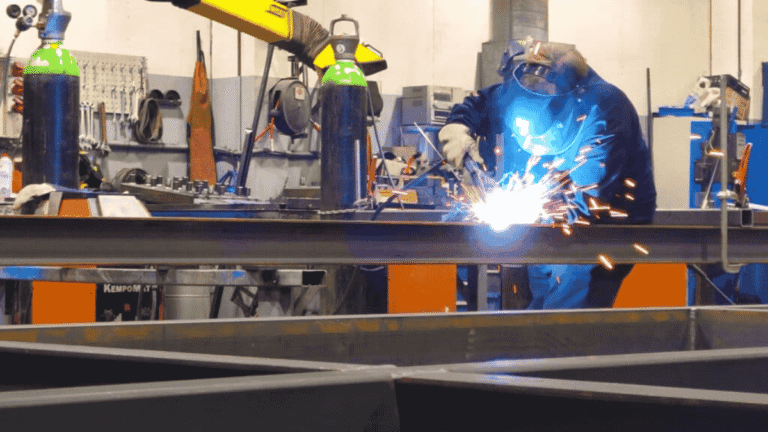
Food & Beverage
Optimized production efficiency
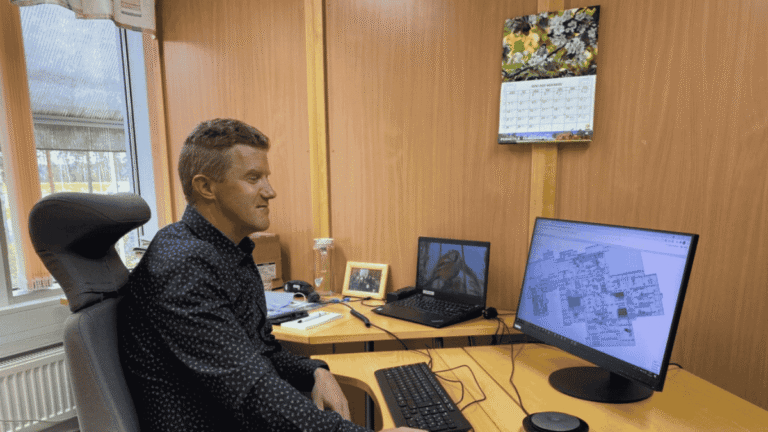
The reform also included a shift from barcodes to RFID technology. “The goal was to enable more precise monitoring of production and obtain more reliable data. Reliable data can be used to improve production processes and achieve cost savings,” says Guy Enkvist, systems specialist at Snellman.
It was decided that the new production system data should be visualized in order to make it available also to the staff in real time. This was the start of the collaboration with Process Genius. The visualization of Snellman’s Pietarsaari and Kerava production plants was implemented using the 3D Digital Twin platform. The platform provides an identical, virtual copy of the physical factory, and it collects and visualizes data from existing devices and systems. Its implementation does not require an upgrade of the production monitoring system or other new system acquisitions.
Once the MES was up and running, line-specific indicators were the first to be visualized. This enabled monitoring of production line operations in real time.
Minimizing waste through real-time cooking process monitoring
Somewhat surprisingly, it was noticed after some time that one of the most useful features of the digital twin platform was control of the cooking process. If a product sits on the line for too long, it becomes waste. “In the cooking department, incoming and outgoing traffic is recorded in each oven and line. For example, we keep track of when a product has gone into the oven and when it has been taken out for cooling. The products have to cool down to a certain point within a certain time, it’s part of quality control,” Enkvist says.
“In practice, we can see nine ovens and six cooling tunnels in real time, and visual information is used to monitor that the products are not left waiting longer than they should,” Enkvist explains. In the past, such process control has been the responsibility of the cook. The systematic visual monitoring that the platform allows has improved the quality of the process.
It was also decided to use an info TV system to make real-time information on the different sites more visible to everyone during production. This allows staff to react more quickly to production deviations.
Minimizing production disruptions saves money
If the starting point of the project was the visualization of packaging lines and the production process, nowadays a larger part of production is covered by measurement and visualization. Everything can be vizualised, but it is particularly important to find the things that are really useful to monitor in production. For example, production room temperatures and hygiene zones, which are important for product safety, have been included as new features in the visualization this year.
According to Filip Sundström, Snellman’s production process controller, the main advantage of the digital twin is that production can see how the upstream and downstream stages are going on the other lines of the line, and can react quickly to any deviations. For instance, if work in the cutting section comes to a halt due to a break in the production pipeline for even a minute, this will make a big dent in the bottom line. Real-time situational awareness can help avoid a very large number of these situations.
The project team has also had ideas to visualize the production process from start to finish. According to Enkvist, this still requires getting used to the idea that 3D models can be used more than they are today.
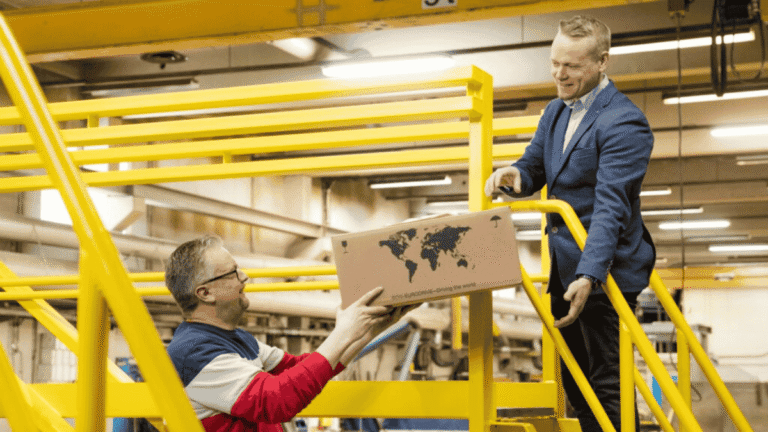
Visualization of storage areas enables timely use of food products
Next, the Snellman project team considered the concrete benefits that could be achieved by visualizing storage facilities. This is a big deal, since there are currently over 10 storage rooms in use, and more are being planned. The solution was Process Genius’ redesigned Genius Core™ platform, which would offer new possibilities to warehouse visualization. Real-time snapshots and “traffic light visualization” based on the expiration date could help ensure that food and raw materials do not expire, thus reducing waste.
The visualization of the storage facilities was first introduced at Snellman’s meat processing plant in Pietarsaari. Following the positive reception of the feature, it was decided to extend the visualization to Snellman’s Kokkikartano plant in Kerava. Further development is already planned, and an updated version of the warehouse feature will be ready for roll-out in early autumn 2021. “Snellman is looking forward to seeing what kind of impact in euros can be achieved,” says Enkvist with optimism. “We have been very pleased to work with Process Genius Oy. We have received exactly what we needed.” We at Process Genius also find it always a pleasure to work with a development-minded partner who understands the potential of new technology.